Onboarding New Students
Navigating the admissions and registration processes of a post-secondary institution can prove difficult for students, who regularly report that the “language” of college admissions, financial aid, and registration, along with adapting to academic norms and even campus wayfinding is intimidating and often defeating. It is therefore imperative that colleges develop practices and procedures that specifically address these and other endemic barriers to admission and matriculation.
The work to support and retain students does not end, however, once students are enrolled in their first courses. The aggregate number of potential students who do not matriculate or do not persist to first-quarter completion represents a significant opportunity for improvement and growth.
Objectives and Strategies
The Onboarding and Entry Work Group identified three objectives on which to focus its work, each with an emphasis of eliminating the equity gap:
- Increase the number of students who enroll after applying to the colleges
- Increase the number of students who successfully complete the first 15 college-level credits
- Increase the number of basic education students who transition to college-level courses
The work group developed six strategies to achieve these objectives:
Strategy A
Simplify application processes.
Strategy B
Monitor students through the entry process using customer relationship management (CRM) software or tracking to eliminate common barriers encountered in financial aid, placement testing, transcript evaluation, parking permit office, and at orientation.
Strategy C
Personalize the support team for each student and ensure the team makes a connection within the first quarter as appropriate, with just-in-time information.
Strategy D
Integrate contextualized learning outcomes and student support messaging into first quarter or “gateway” (high enrollment/low completion) courses.
Strategy E
Address transition barriers with additional I-BEST programs, financial aid (Ability to Benefit), Guided Pathways, and basic skills integration.
Strategy F
Provide customized orientation for basic education (BEdA) students transitioning to college-level courses.
Simplify application processes.
- The work group recommends that the Washington State Student Services Commission (WSSSC) consider integrating the online admission application with a customer relationship management (CRM) tool and make this a functional requirement when evaluating options for the online application redesign.
Monitor students throughout the entry process.
- The Onboarding and Entry Work Group recommends filling in the data gaps (e.g. percent of financial aid applications processed; financial aid application processing times; transcript evaluation processing times with disaggregated metrics for underserved student groups) for the entry process and ensure that Guided Pathways strategies to improve entry processes are informed by this additional data.
- The work group recommends colleges ensure that concurrent work by strategic enrollment management teams is closely aligned and synchronized with Guided Pathways implementation work.
Personalize the support team for each student and ensure the team makes a connection within the first quarter.
- Colleges should take the time to fully scope what career advising means, what student outcomes are desired, and how it will be measured.
- Colleges must define what academic advising means, expected outcomes, and how those outcomes will be measured.
- Colleges must assign responsibility to specific roles, and ensure that faculty are fully involved in early enrollment management efforts.
Integrate contextualized learning outcomes and student support messaging into first quarter or “gateway” (high enrollment/low completion) courses.
- Intentionally design innovative teaching practices and assignment design into first quarter and gateway classes. Colleges should consider this work as capacity building in equitable system design. the work group recommends a close examination of the work done by The Bill and Melinda Gates Foundation Frontier Set, which has demonstrated considerable success in closing equity gaps for their students.
Address transition barriers with additional I-BEST programs, Ability to Benefit, Guided pathways, and basic skills integration.
- Create better integration between the curricula for basic education and developmental courses and entry college-level courses
- Colleges can provide intensive supports to student making this transition by sharing Ability to Benefit resources with students as part of their integrated transition planning
Provide customized orientation for basic education (BEdA) students transitioning to college-level courses.
- Colleges should review their strategies for providing guidance to students who are nearing completion of basic education coursework and may not be prepared for the unique challenges of academic planning and coursework
- Work with external agencies or leverage existing partnerships to provide targeted supports to students who want to transition to college-level but may have difficulty due to external factors such as transportation, childcare and employment
Metrics
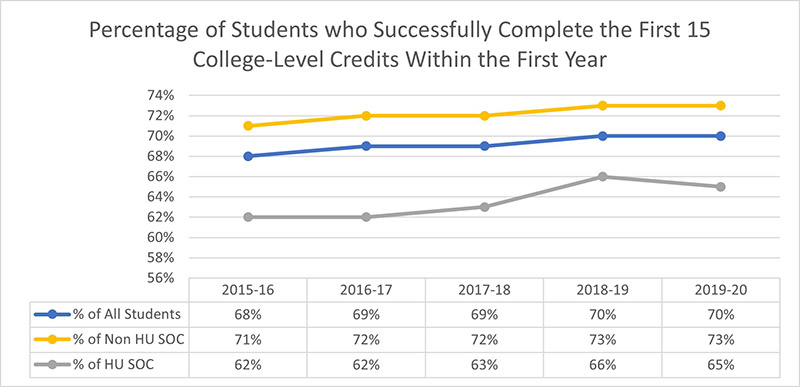
Percentage of students who successfully complete the first 15 college-level credits within the first year

The Percentage of Students who Successfully Complete the First 15 College-Level Credits Within the First Year diagram shows the percentage of award-seeking students completing 15 college-level credits in their first year, over the last five years. The percentage has grown from 68-percent in 2015-16 to 70-percent in 2019-20. The percentage of historically underserved students of color earning 15 college-level credits in their first year has grown from 62-percent to 65-percent.
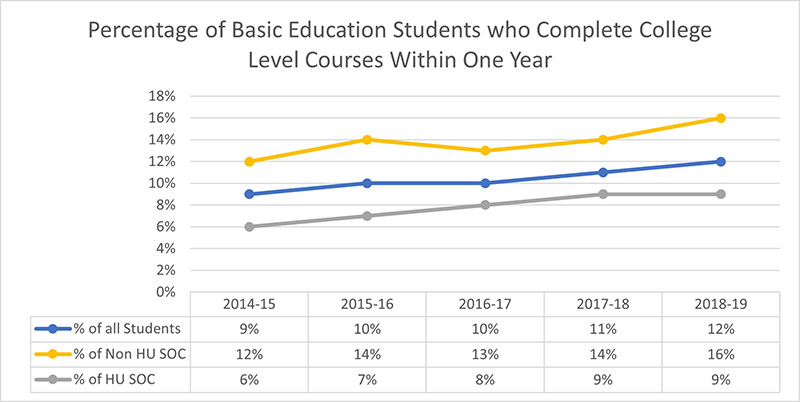
Percentage of Basic Education students who complete college-level courses within one year

The Percentage of Basic Education Students who Complete College-Level Courses Within One Year diagram shows the percentage of adult basic education students who complete a college-level course in their first year. The percentage has grown from 9-percent in 2014-15 to 12-percent in 2018-19. The percentage of historically underserved adult basic education students of color completing a college-level course in their first year has grown from 6-percent to 9-percent.