Keeping Returning Students
The Retention and Persistence Work Group focused its work on students who complete their first year. As it dove into its research, work group members found that colleges successfully employed many methods to address each strategy it employed.
The common thread through each colleges’ approach, though, was the fundamental way in which college culture evolved to become student-ready, thereby supporting student success in a more equitable, direct, relational, and student-centered way. The cultural shift affected all aspects of how a college delivered its service — especially with student services and instruction — adapting to student needs, rather than asking a student to adapt to the college’s established structure.
Objectives and Strategies
The Retention and Persistence Work Group identified four objectives on which to focus its work, each with an emphasis on eliminating the equity gap:
- Increase the number of students who successfully complete the first 30 college-level credits
- Increase the number of students continuing to enroll through the first 45 credits
- Increase the number of students continuing to progress from year to year
- Increase the number of students who complete college-level English and math within the first year
The work group developed three strategies to achieve these objectives:
Strategy A
Introduce positive one-on-one student support strategies that are culturally relevant (e.g. individual student meetings with faculty; inclusive pedagogy; learning all students’ names; in-class calendaring/time management assignment; student services initial contact; faculty mentorship) to create a sense of belonging for students. This strategy addresses objectives 1 and 2.
Strategy B
Consistent with guided pathways transformation, choose course sequences and course combinations for each degree and certificate program to maximize student success and student learning. Wrap-around advising and targeted supports that are culturally relevant, specific to the courses, are provided to students in challenging course combinations. This strategy addresses all four objectives.
Strategy C
Gathering and sharing best practices to support for Accelerated, Stretch, and Pace models that result in equitable outcomes. This can include contextualization of math and English and math pathways curriculum at all levels. This strategy addresses all four objectives.
Introduce positive one-on-one student support strategies that are culturally relevant to create a sense of belonging for students.
- Establish a clear relationship between student learning in the classroom and college outcomes
- Provide a framework for faculty to connect with students in ways that are productive for both faculty and students.
- Convene faculty learning communities and communities of practice to support and adopt new models of interacting with students.
- Communicate and reinforce that even small changes are not easy.
- Engage employees in professional development that enhance equity-mindedness and a way to take actionable steps in interactions with students and with curriculum.
Consistent with Guided Pathways transformation, choose course sequences and course combinations for each degree and certificate program to maximize student success and student learning. Wrap-around advising and targeted supports that are culturally relevant, specific to the courses, are provided to students in challenging course combinations.
- Create a professional development program, both at the state-level and college-level, that models strategies used by Achieving the Dream, e.g., coaching how to lead effective change, using data to measure success and inform the development of student success strategies, professional development opportunities specific to equity, holistic student supports, and teaching and learning.
- Engage employees in adapting to changes that improve climate.
- Adopt five or fewer objectives as the Guided Pathways outcomes (or Voluntary Framework Accountability) and have Tableau reports for the system and college that disaggregates the data by race, sex, age and socioeconomic status.
Gathering and sharing best practices to support for Accelerated, Stretch, and Pace models that result in equitable outcomes. This can include contextualization of math and English and math pathways curriculum at all levels.
- Incentivize, similar to I-BEST, approaches to accelerating development math and English with deliberate attention to closing the opportunity/equity gap in attainment of college-level math and writing credit within the first year.
- Provide faculty development and state-wide faculty communities of interest regarding accelerating developmental curriculum.
Metrics
Percentage of students who successfully complete first 30 college-level credits within two years
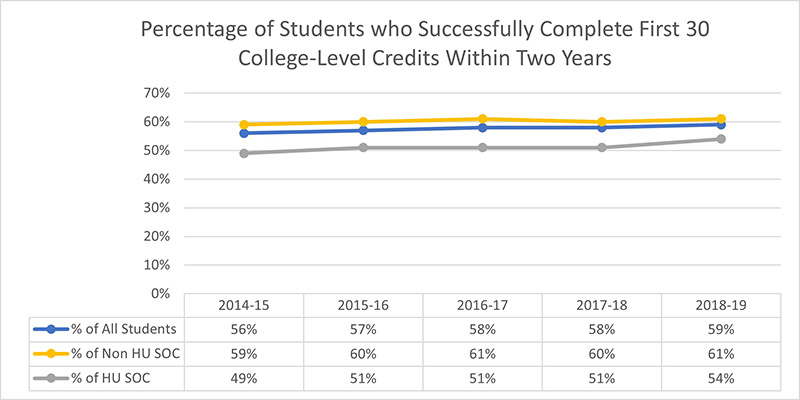
The Percentage of Students who Successfully Complete First 30 College-Level Credits Within Two Years diagram shows the percentage of award-seeking students completing 30 college-level credits in their first two years, over the last five years. The percentage has grown from 56-percent in 2014-15 to 59-percent in 2018-19. The percentage of historically underserved students of color earning 30 college-level credits in their first two years has grown from 49-percent to 54-percent.
Percentage of students continuing to enroll through the first 45 college-level credits within two years
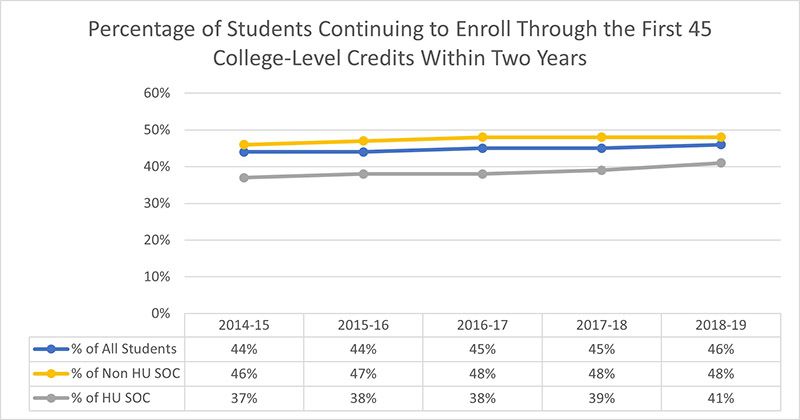
The Percentage of Students Continuing to Enroll Through the First 45 College-Level Credits Within Two Years diagram shows the percentage of award-seeking students completing 45 college-level credits in their first two years, over the last five years. The percentage has grown from 44-percent in 2014-15 to 46-percent in 2018-19. The percentage of historically underserved students of color earning 45 college-level credits in their first two years has grown from 37-percent to 41-percent.
Percentage of students progressing from first to second year
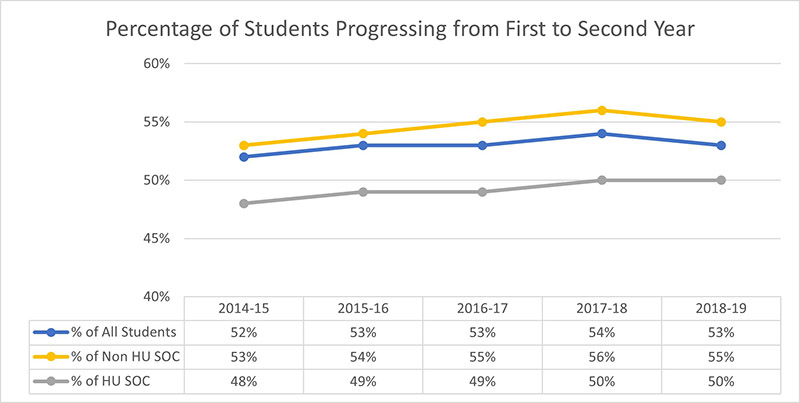
The Percentage of Students Progressing from First to Second Year diagram shows the percentage of award-seeking students still enrolled after one year, over the last five years. The percentage has grown from 52-percent in 2014-15 to 53-percent in 2018-19. The percentage of historically underserved students of color still enrolled after one year has grown from 48-percent to 50-percent.
Percent of students who complete college-level English within the first year
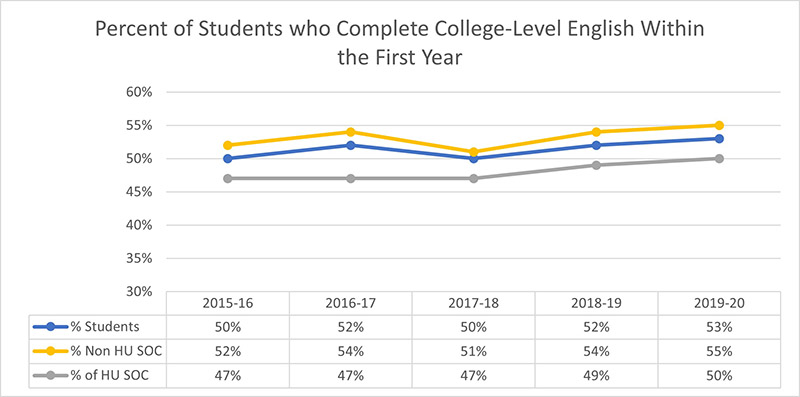
The Percent of Students who Complete College-Level English Within the First Year diagram shows the percentage of award-seeking students completing a college-level English course in their first year, over the last five years. The percentage has grown from 50-percent in 2015-16 to 53-percent in 2019-20. The percentage of historically underserved students of color completing a college-level English course in their first year has grown from 47-percent to 50-percent.
Percent of students who complete college-level math within the first year
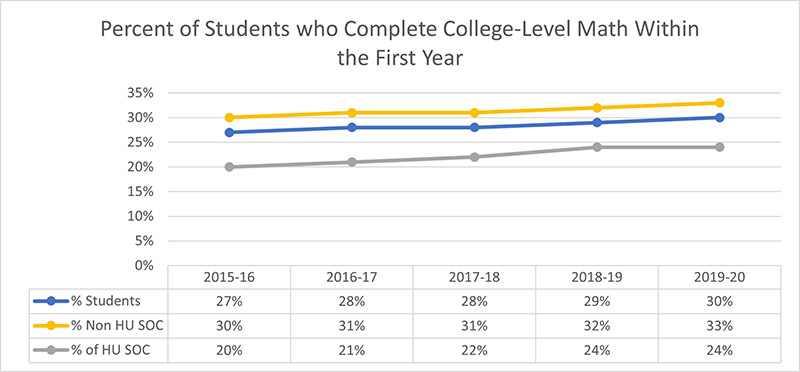
The Percent of Students who Complete College-Level Math Within the First Year diagram shows the percentage of award-seeking students completing a college-level Math course in their first year, over the last five years. The percentage has grown from 27-percent in 2015-16 to 30-percent in 2019-20. The percentage of historically underserved students of color completing a college-level Math course in their first year has grown from 20-percent to 24-percent.